Seacoast NH & North Shore MA Vacation Rental Market Report: June 2026
This report covers May 2026 actuals and forward summer pacing across the Seacoast New Hampshire and North Shore Massachusetts short-term rental markets. Data reflects 100 properties managed by Seacoast 2 Summit, benchmarked against KeyData market data covering Seacoast New Hampshire and North Shore Massachusetts vacation rental properties. Pull date: June 1, 2026.
May 2026 Market Performance
Seacoast New Hampshire delivered its weakest May in two years. The market averaged $216 ADR, 38.6% occupancy, and $83 RevPAR, down 10.8% from $93 RevPAR in May 2025. Both ADR and occupancy declined year over year, compressing returns across the board. The average booking window shortened by four days, meaning guests committed later and with less lead time than the prior year.
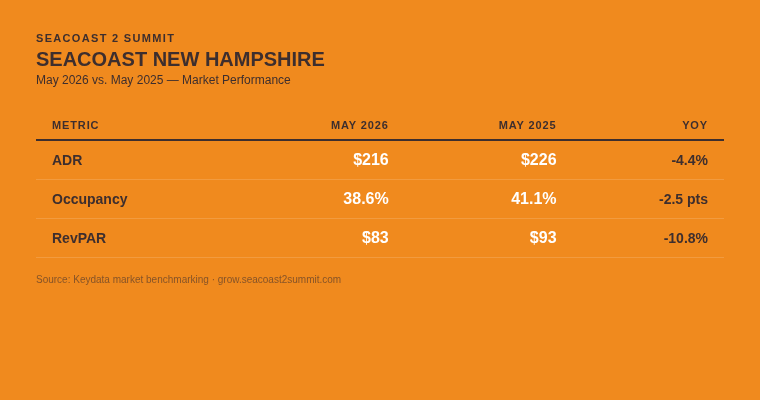
Source: KeyData market benchmarking, Rockingham County NH (Portsmouth, Rye, Hampton, Hampton Beach, North Hampton, Seabrook — 114 properties). RevPAR = ADR x Occupancy.
North Shore Massachusetts moved in the opposite direction. The market averaged $273 ADR and 43.9% occupancy in May, producing $120 RevPAR, up 13.2% from $106 RevPAR in May 2025. Both ADR and occupancy improved year over year. Plum Island, Newburyport, and Salisbury drove the strongest performance, with coastal properties commanding premium rates through Memorial Day weekend. Guests booking into North Shore Massachusetts averaged 51 days out, three days longer than the prior year and nearly three weeks longer than Seacoast New Hampshire guests.
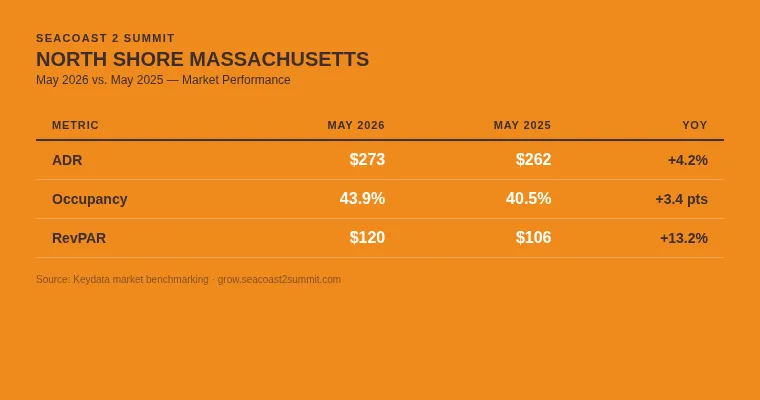
Source: Key Data market benchmarking, Northeast Massachusetts (Newburyport, Salisbury, Plum Island, Gloucester, Rockport and surrounding communities — 205 properties). RevPAR = ADR x Occupancy.
Curious what your property could earn with active revenue management? Request a free revenue projection from Seacoast 2 Summit.
Summer Pacing: What Is Already on the Books
The following figures reflect actual reservations already made for June, July, and August 2026, pulled June 1 from Key Data market data. These are not projections. They are bookings in hand across both markets.
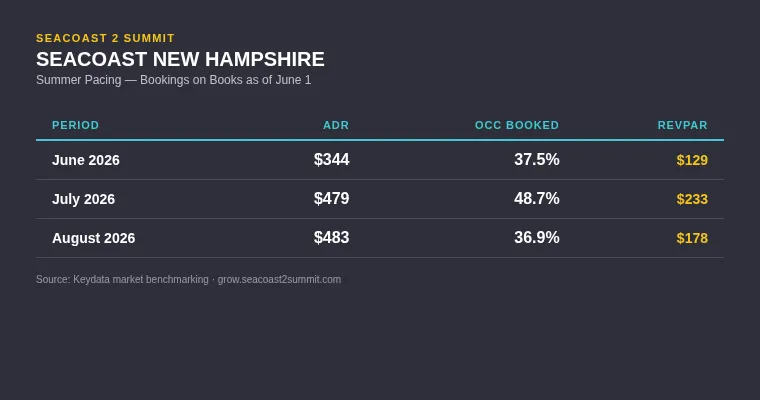
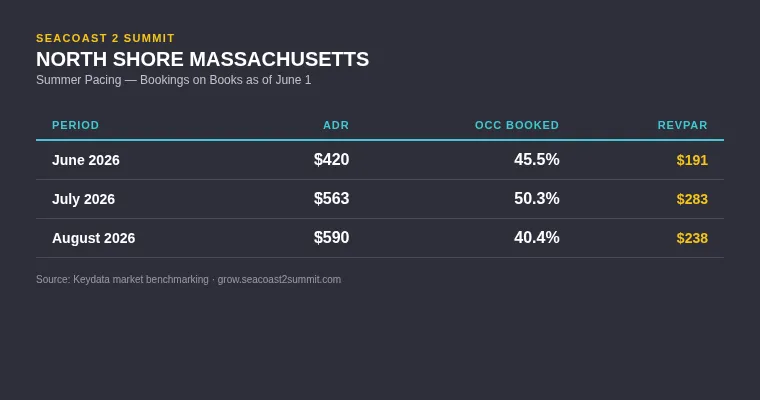
Source: Key Data market benchmarking. Occupancy reflects reservations on books as of June 1, 2026. Final occupancy will be higher as additional bookings are made through the summer.
July is the standout month across both markets. Seacoast New Hampshire is running $479 ADR with nearly half of July already committed. North Shore Massachusetts is at $563 ADR with just over half of July already booked. Properties on Plum Island, Salisbury Beach, and in Newburyport are among the strongest performers, reflecting the premium that limited oceanfront supply commands during peak summer months.
Comparing July RevPAR to May RevPAR shows the true scale of the seasonal opportunity. Seacoast New Hampshire went from $83 RevPAR in May to $233 already on the books for July. That $150 swing is the window active revenue management is designed to capture: positioning a property for the highest-value demand before that window closes.
August is pacing conservatively on occupancy in both markets, consistent with seasonal patterns. The 36.9% and 40.4% figures will continue climbing through June and into July. The properties that convert August at $483 to $590 ADR are the ones managing availability and rates actively today.
Why These Two Markets Perform Differently
The performance gap between Seacoast New Hampshire and North Shore Massachusetts is real and consistent. Understanding what drives it matters whether you own a property in either market or are considering an acquisition.
Acquisition cost is the starting point. Median home prices in the North Shore Massachusetts coastal markets run meaningfully higher than their New Hampshire counterparts. Hampton Beach, the most active rental submarket on the New Hampshire coast, had a median home price around $595,000 as of late 2025. Newburyport median prices range from $815,000 to over $900,000 depending on the neighborhood. Plum Island, with its limited supply of direct ocean-access properties, trades at a median around $1,000,000 to $1,140,000. When a homeowner pays more to acquire a property, two things follow: the property itself tends to have stronger amenities, finishes, and square footage, and the owner needs to generate more revenue per night to make the numbers work. Both push ADR higher.
The guest profile differs. North Shore Massachusetts guests book 51 days in advance and stay 4.2 nights on average. Seacoast New Hampshire guests book 32 days out and stay 3.1 nights. Longer booking windows and longer stays are consistent with a more affluent, more intentional traveler. A guest who plans a trip seven weeks ahead, books without last-minute pressure, and stays four-plus nights is typically less price-sensitive and less likely to cancel.
The destination experience extends beyond the beach. Newburyport brings a full destination: award-winning restaurants, a historic waterfront district, art galleries, boutique retail, and year-round events. Plum Island adds true barrier island scarcity, with a small number of direct oceanfront properties and no new supply. Seacoast New Hampshire offers excellent beaches, but the draw is more concentrated around a traditional summer beach experience rather than a full-season destination. That distinction affects both the length of the shoulder season and the ADR that guests will accept.
Supply and tax structure create asymmetry. New Hampshire has no state income tax or sales tax, which benefits property owners on net operating income. Massachusetts imposes a higher short-term rental excise tax. However, those structural differences do not appear to suppress North Shore Massachusetts demand, since the guest experience and property quality justify the premium. The tax advantage for New Hampshire owners exists but does not close the RevPAR gap on its own.
None of this means Seacoast New Hampshire is a weaker investment. Lower acquisition costs mean lower barriers to entry and a different return profile. A Hampton Beach property acquired at $595,000 generating $83 market RevPAR in May can still pencil out well if carrying costs are managed and peak-season revenue is maximized. The key is understanding which market you are in and building a revenue strategy around its specific demand patterns rather than applying assumptions from one coast to the other.
The Number That Actually Matters
Most homeowners track occupancy. It is the wrong metric.
Occupancy tells you how full your calendar is. It says nothing about how much money you made. A property at 100% occupancy at $200 per night generates $6,000 in a 30-night month. A property at 75% occupancy at $320 per night generates $7,200 in the same month, with fewer guests, fewer turnovers, and less wear on the property.
RevPAR, revenue per available night, tells the complete story. Multiply your ADR by your occupancy rate. The result captures both pricing strength and demand conversion in a single number, and it is the only metric that allows an honest comparison between your property and the market.
With average market occupancy still hovering between 40-50% for this summer, a property that is already at 100% occupancy is almost certainly priced too low. It is absorbing demand that should have been rationed at higher rates. The guests who booked first got a deal, while the owner got a busy calendar and a RevPAR below what the market could have supported.
The goal is not a full calendar. The goal is the highest RevPAR the market will support, which requires rates that start higher, adjust dynamically, and close out availability only when doing so improves total revenue, not just fills empty nights.
When Your Best Guests Actually Book
The most common assumption self-managing homeowners make: summer vacationers book 6-12 months in advance. The data does not support it.
Guests booking Seacoast New Hampshire properties averaged 32 days out in May 2026, down from 36 days the prior May. Guests booking North Shore Massachusetts properties averaged 51 days out. The guests who stayed in these markets last month made their decision five to seven weeks before arrival.
That has direct implications for how peak season fills up. Roughly half of this summer has been filled by the guests who plan ahead, commit early, and pay full price.
But the other half of guests who will fill the summer book differently. They book shorter stays. They book later.
Self-managers who maintain fixed pricing and strict minimum stay policies (traditionally 7 nights or more with Saturday to Saturday check ins and check outs) risk losing half of the potential market demand. This results in weaker ADR and thus weaker RevPAR. This is why a dynamic and constantly monitored revenue management strategy matters in highly seasonal markets like Seacoast New Hampshire and North Shore Massachusetts.
What Homeowners Should Do Before July 1
The booking curve for July has passed its steepest point. The strategy has to shift.
If your July has significant open dates, holding peak-season rates on open mid-week nights costs you bookings without improving RevPAR. The guests still booking July today are price-aware and comparing across multiple listings. Adjusting rates to reflect real remaining demand, and opening minimum stay flexibility on mid-week gaps, will do more to convert those bookings than waiting for late-bookers to accept April pricing.
If your August is under 40% booked, you are at market average but the window for premium August bookings is narrowing. The families who book two months ahead are making decisions now. Strong listing photos showing summer-specific amenities, a competitive rate for the first 30 days of August availability, and accurate amenity descriptions are the highest-leverage actions before those guests commit elsewhere.
For owners still deciding whether to list or whether to change management, this report illustrates the core dynamic: the most important revenue decisions happen in April and May, not in July. Properties that enter peak season with strong rates already committed, built on a foundation of early-booking demand captured at the right price, consistently outperform properties that rely on late-summer volume to close the gap.
Seacoast 2 Summit manages over 100 vacation rental properties across Seacoast New Hampshire and North Shore Massachusetts. See what active revenue management could mean for your property.
About This Report
This report is produced monthly by Seacoast 2 Summit, a vacation rental management company operating across Seacoast New Hampshire, North Shore Massachusetts, and the New Hampshire Lakes and White Mountains regions. Market benchmarking data is sourced from Pricelabs and Key Data, covering properties in Rockingham County, New Hampshire (Portsmouth, Rye, Hampton, Hampton Beach, North Hampton, Seabrook) and properties in Northeast Massachusetts (Newburyport, Salisbury, and Plum Island). Portfolio occupancy data reflects PriceLabs adjusted occupancy, excluding owner-blocked nights. RevPAR is calculated as ADR multiplied by occupancy rate. Property value data sourced from Zillow and Redfin, reflecting 2025 and early 2026 market data.
Frequently Asked Questions
What does RevPAR mean for vacation rental owners in Seacoast New Hampshire?
RevPAR stands for revenue per available night. Multiply your average daily rate by your occupancy rate to calculate it. A property earning $400 per night at 60% occupancy generates a RevPAR of $240. A property earning $300 per night at 100% occupancy generates a RevPAR of $300, with more guests, more turnovers, and more operational cost. RevPAR is the only metric that shows whether your pricing strategy is working, because it captures both rate strength and demand conversion in a single number. The Seacoast New Hampshire market averaged $83 RevPAR in May 2026 and is pacing toward $233 RevPAR for July.
Why is 100% occupancy not necessarily a good sign for my vacation rental?
Full occupancy means every available night sold. It does not mean every available night sold at the right price. In a market where the average property fills only 38.6% of its nights, a property at 100% occupancy almost certainly priced below what the market could support. The demand that filled that calendar was demand that should have been rationed at higher rates. The better target is 75 to 85% occupancy at a rate that maximizes RevPAR, which typically produces more revenue with fewer guests and less operational complexity than chasing 100% at whatever price fills the calendar fastest.
Why do North Shore Massachusetts vacation rentals earn more than Seacoast New Hampshire rentals?
Several factors drive higher RevPAR on the North Shore. Acquisition costs are significantly higher, with Plum Island and Newburyport properties trading at $900,000 to over $1,100,000 compared to $595,000 to $689,000 for typical Seacoast New Hampshire coastal properties. Higher acquisition costs produce higher-quality properties with stronger amenities, which support higher ADR. North Shore Massachusetts also benefits from Newburyport as a full destination, with year-round dining, culture, and events that extend the season beyond the peak summer window. Guest booking windows are longer in Massachusetts (51 days vs. 32 days in New Hampshire), which is consistent with a more affluent traveler who plans further ahead and is less price-sensitive.
How far in advance do guests book vacation rentals on the North Shore of Massachusetts?
Guests booking North Shore Massachusetts vacation rentals averaged 51 days in advance in May 2026. For summer bookings, the window is often longer. Homeowners who price and optimize their listings at least 60 days before peak dates capture the most organized, highest-intent segment of summer demand. Plum Island and Newburyport properties benefit most from early listing optimization because supply is limited and guests searching those areas book quickly when they find the right property at a price they trust.
Is Plum Island a strong vacation rental market heading into summer 2026?
Yes. Plum Island sits within the Northeast Massachusetts vacation rental market, which is pacing at $563 ADR and 50.3% occupancy already booked for July as of June 1. Plum Island properties consistently command rates above the North Shore Massachusetts market average due to direct oceanfront access, a small and fixed supply of rental-eligible homes, and strong repeat guest demand. Median home values on Plum Island range from $1,000,000 to $1,140,000, reflecting the premium the market places on that specific location. Summer pacing on Plum Island reflects the broader North Shore Massachusetts pattern: half of peak-season nights already committed, with remaining inventory positioned for guests booking in June and early July.