Seacoast NH Vacation Rental Market Report: Spring 2026 + Summer Outlook
Market data and portfolio performance across Portsmouth, Rye, North Hampton, Hampton, and Seabrook. April 2026 actuals, May shoulder pacing, and summer income projections for Seacoast New Hampshire homeowners. All data sourced from PriceLabs market intelligence as of May 1, 2026, across 66 active Seacoast 2 Summit-managed properties in the area.
April 2026: How Seacoast New Hampshire Properties Performed
April is where coastal New England starts to separate managed properties from the field. Spring break demand, warmer weekends, and early-season travelers begin filling calendars, but only for properties that are priced correctly, listed on the right channels, and actively managed.
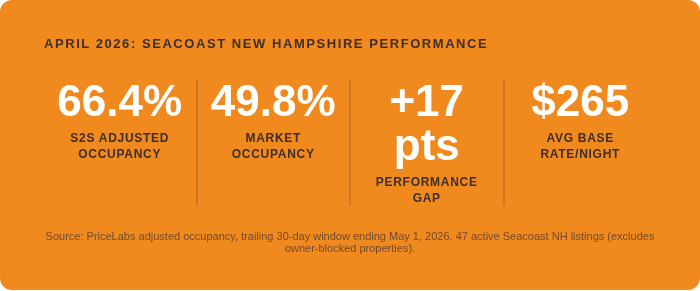
Seacoast 2 Summit properties across Seacoast New Hampshire ran at 66.4% occupancy in April based on adjusted trailing 30-day data ending May 1, 2026. The broader Seacoast New Hampshire market averaged 49.8% occupancy over the same window. That is a 17-point gap in favor of managed properties during what is still technically a shoulder month.
For context, a 3-bedroom property running 66% occupancy in April at a $266 average nightly rate generates roughly $6,100 in gross revenue in a single shoulder-season month. That is not peak season money, but it is meaningful income from a month that self-managed properties routinely leave mostly empty or book for lower rates with a winter rental.
The market average is a floor, not a ceiling. A hot tub, ocean view, or renovated kitchen can add thousands more. Get a free estimate built around your actual property.
What Separates Top Performers from the Market Average
Two 3-bedroom homes in the same zip code with the same base rate can perform very differently depending on what they offer. The properties in our Seacoast New Hampshire portfolio that consistently outperform their tier share a recognizable profile:
Hot tub or private outdoor amenity: the single most consistent revenue driver on the Seacoast. Properties with hot tubs book earlier, hold rate better in shoulder season, and attract longer stays.
Ocean or water views: an ocean view adds 20-35% to achievable nightly rate versus an equivalent inland property. Hampton and Rye oceanfront properties consistently lead the portfolio in RevPAR.
Professional interior design and photography: listing conversion is heavily influenced by first impression. Professionally designed properties generate more saves and inquiries per impression than comparable properties with amateur photos.
Outdoor entertaining space: decks, fire pits, and private yards extend the bookable season into May and September by attracting shoulder guests who would otherwise skip a beach property.
Pet-friendly designation: removes a booking filter for a large demand segment. Pet-friendly properties maintain higher occupancy in the shoulder months when overall demand is softest.

May Pacing: The Gap Stays Wide
May pacing is where the management gap shows up most clearly at this point in the season. Seacoast 2 Summit properties are running at 43.8% for May versus a market average of 29.8%. That is a 14-point spread with the month already underway. Nearly three quarters of the market's May calendar is still empty. The managed portfolio has already filled nearly half of it.
The June window shows both Seacoast 2 Summit and the broader market at essentially the same pacing: 27.1% versus 29.3%. This is normal and expected. At 30-60 days out in May, Seacoast properties with strong summer calendar and revenue management are holding June rates bound for strong demand as schools get out and, in this year's case, as the FIFA World Cup comes to the States. The same calendar that looks "thin" in June at this moment will look very different in a month as summer bookings accelerate.
Every property has a different revenue ceiling. We model yours for free using real comp data from our active Seacoast New Hampshire portfolio.
Summer 2026 Outlook: June, July, and August
The 90-day forward window now reaches into the heart of summer. Seacoast 2 Summit properties are pacing at 39.0% occupancy versus a market average of 34.8% across the next 90 days. With projected occupancy between 80-90%, this data shows there is still plenty of time to attract summer stays without sacrificing rate. For homeowners questioning their empty calendar, the answer is to stay patient. And if your calendar is already 100% occupied, the question becomes: are you charging enough? Which is why at Seacoast 2 Summit, the only real metric that matters is RevPAR.
Why RevPAR Is the Number That Matters
RevPAR, Revenue Per Available Rental Night, is calculated by multiplying average daily rate by occupancy. It is the single most complete measure of portfolio performance because it captures both what a manager charges and how consistently they fill the calendar. A property that commands a high nightly rate but sits half-empty does not outperform one that charges a fair rate and stays full. RevPAR captures the combined result at once.
Rate Trajectory: From Shoulder to Peak
The rate story is where summer becomes a different conversation entirely. Current PriceLabs portfolio pricing shows the average nightly rate climbing sharply from the May baseline into peak season:
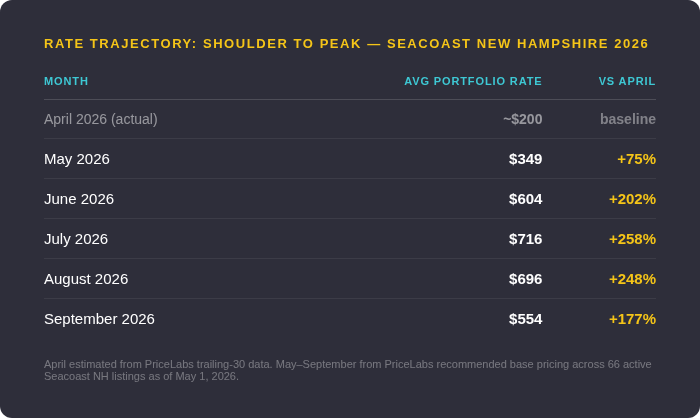
The jump from May to June is where Seacoast New Hampshire shifts from shoulder to peak. A 3-bedroom Hampton home running $266 in May runs $500 or more in July. For homeowners evaluating whether rental income makes sense, the summer rate trajectory is the reason the math works, even if the property sits partially vacant in January and February.
What Seacoast New Hampshire Homeowners Should Do Right Now
Summer 2026 booking activity is fully underway. The best July and August weeks book 8 to 12 weeks in advance, which means right now. Properties that are not listed, optimized, and priced before mid-May miss a meaningful share of peak summer demand.
If you own a home in Hampton, Portsmouth, Rye, North Hampton, or Seabrook and are considering listing it, here is the realistic timeline: onboarding, photography, listing creation, and pricing setup take approximately two to three weeks. A property that starts the process this week is positioned to capture late June and July bookings. One that waits until Memorial Day will spend the summer catching up.
The market data shows what the average property earns. Your property's actual ceiling depends on specifics: where it is, what it has, what condition it is in, and what amenities you offer. We build a property-specific model for free, based on real comp data from our active Seacoast New Hampshire portfolio.
Want to know what your Seacoast New Hampshire home can earn this summer? Get a free, property-specific estimate here.
About This Report
Seacoast 2 Summit publishes monthly market updates for Seacoast New Hampshire and North Shore Massachusetts. We manage over 100 active properties across Hampton, Portsmouth, Rye, North Hampton, Seabrook, Salisbury, Newbury, Newburyport and Plum Island, as well as a handful of properties in the lakes and mountains of New Hampshire. Portfolio performance data is sourced from PriceLabs, which aggregates real-time booking and pricing data across all active listings. Market benchmarks reflect all active short-term rental listings tracked in each market.
If you own a home in Seacoast New Hampshire, request a free revenue estimate here.
Frequently Asked Questions
When is the best time to list my Seacoast New Hampshire property for summer 2026?
Now. The best summer weeks are booking right now, 8 to 12 weeks in advance. Onboarding, photography, and listing setup take two to three weeks. A property starting this week is positioned to capture late June and July bookings. Waiting until Memorial Day means competing for whatever demand is left after the prime weeks have already been claimed.
How does professional management outperform self-management on the Seacoast?
April 2026 data shows Seacoast 2 Summit properties running 17 percentage points above the broader Seacoast New Hampshire market occupancy rate: 66.4% versus 49.8%. The gap comes from dynamic pricing that adjusts nightly rates in real time, multi-channel distribution across Airbnb, VRBO, and Booking.com simultaneously, and guest communication and review management that compounds into stronger search ranking over time.
What amenities increase vacation rental income the most in Hampton and Portsmouth?
In our Seacoast New Hampshire portfolio, the highest-impact amenities are hot tubs (earlier bookings, stronger shoulder occupancy, higher rate tolerance), ocean or water views (20-35% rate premium versus equivalent inland properties), professional interior design and photography (higher conversion from listing views to bookings), outdoor entertaining space (extends the bookable season into May and September), and pet-friendly designation (fills occupancy gaps in low-demand months).
How do I find out what my specific home would earn as a vacation rental?
The most accurate way is a property-specific revenue model built on real comp data from active listings in your area. We build these for free using our live Seacoast New Hampshire portfolio data. Visit grow.seacoast2summit.com to request yours, or call us to speak with a local market specialist directly.